
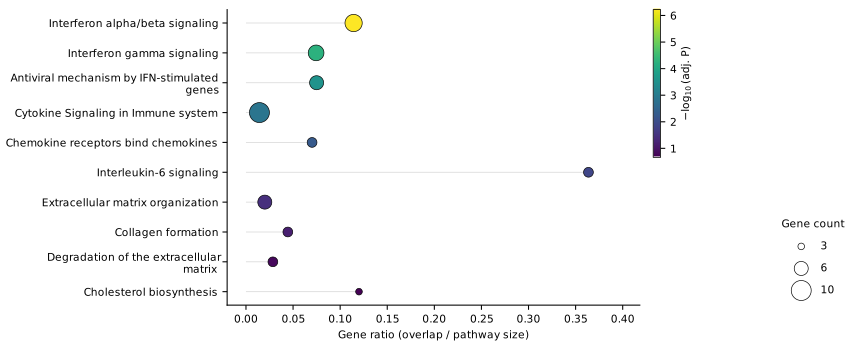
Dot plotThe classic: significance, gene ratio and size at a glance.
For RNA-seq and pathway enrichment analysis
One Enrichr table.
Eight publication-ready figures.
Enrichr gives you the statistics – and a bar chart. MES.Plot turns the same table into dot plots, enrichment maps, networks, heatmaps and more: in journal quality, checked for data errors and traceable down to the individual row.
- Eight plot types
- Data check on every load
- PNG/TIFF 600 dpi, SVG
- Colour-blind safe
Eight views on the same result
Each plot type answers a different question – from “what is enriched?” to “which genes connect these pathways?”.
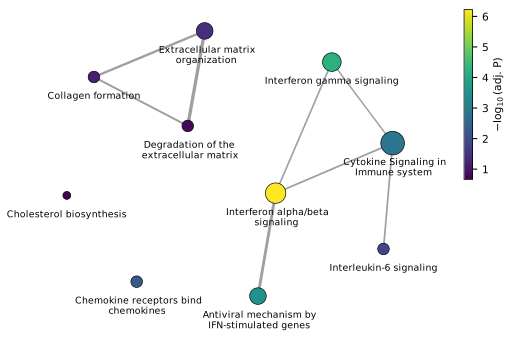
Enrichment mapWhich terms describe the same biology?
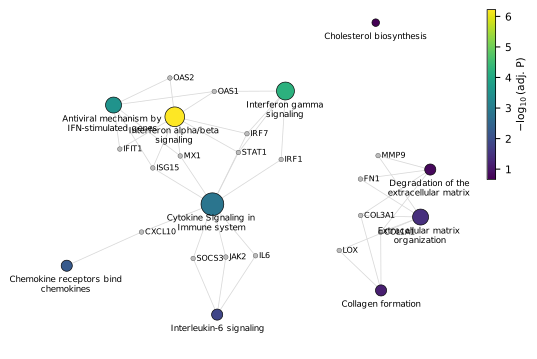
Gene–pathway networkWhich genes connect the pathways?
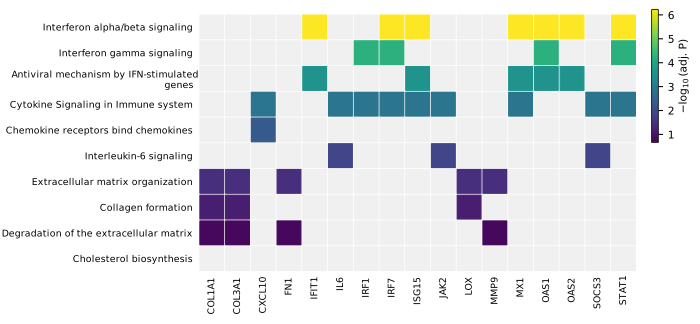
Term × gene heatmapThe whole membership table in one compact figure.
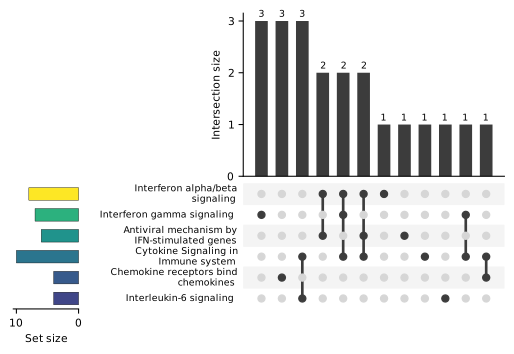
UpSet plotSet overlaps without Venn diagrams.
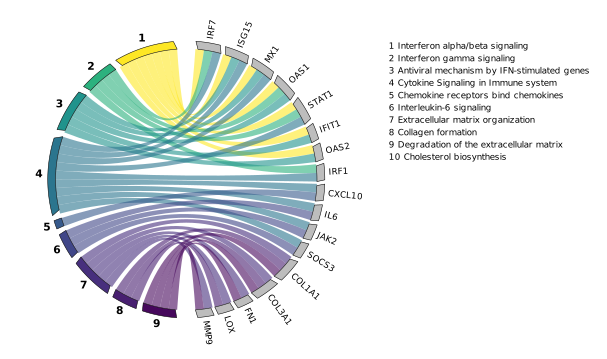
Chord diagramTerms and genes connected by ribbons.
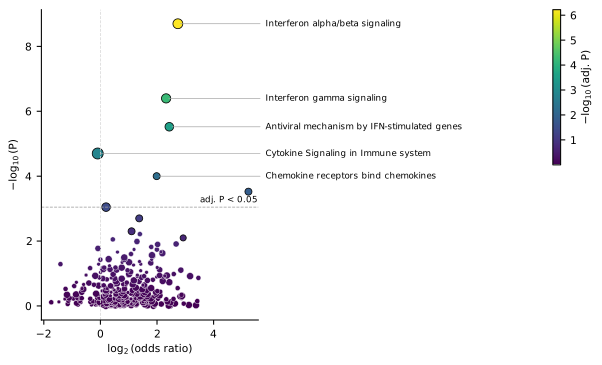
Enrichment volcanoAll terms at once, not just the top ten.
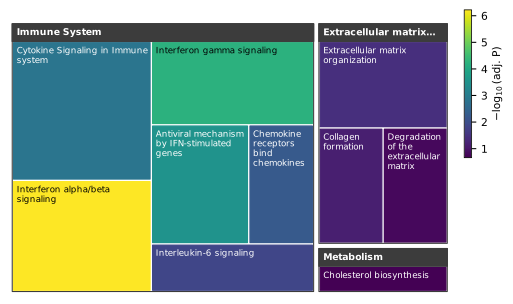
TreemapWhere in biology do your hits lie?
Illustration with demo data
How it works
- Export from EnrichrOpen your result in Enrichr, switch to the table view of a library – for example Reactome_Pathways_2024 – and download it as a text file.
- Load it into MES.PlotMES.Plot reads the table and checks it straight away: unreadable rows, inconsistent overlaps, Excel date artefacts in gene symbols and a full recalculation of the Benjamini–Hochberg correction.
- Choose, adjust, exportPick one of eight plot types, select the terms, set the size in millimetres, font and colour scale – and export PNG or TIFF at 600 dpi or an editable SVG.
Made for journals
- Exact size. Width and height in millimetres, font and font size in points – matching single- or double-column figures.
- Print-ready formats. PNG and TIFF at 600 dpi without alpha channel, SVG with editable text for Illustrator or Inkscape.
- Colour-blind safe. Viridis by default; a red–green scale is available where it is expected.
- One visual language. Every plot uses the same colour scale and legends, so figure panels fit together.
- Your order. Sort by significance, gene ratio, gene count or score – or pick terms by hand.
Trust, but verify
A figure in a paper has to be right. MES.Plot makes it easy to check that it is.
- Data check on every load – with row numbers, so you can find each problem in the file.
- Hover to see the numbers behind every dot, cell, bar and ribbon.
- SVG files that explain themselves: every data mark carries its values as a tooltip.
- Tested against known answers: automated tests check every plot type against hand-calculated results.
Frequently asked questions
Does MES.Plot run the enrichment analysis?
No. The statistics come from Enrichr. MES.Plot visualises the exported table and checks it for consistency – it does not change any P-value.
Which Enrichr libraries are supported?
Any library exported as a table (Reactome, GO, KEGG, WikiPathways, MSigDB and more). Only the treemap needs the Reactome hierarchy, because it groups terms by Reactome's top-level categories.
Can I edit the figures afterwards?
Yes. SVG exports keep text as text, so labels can be changed in Illustrator, Inkscape or Affinity without redrawing the plot.
What does MES.Plot not check?
Anything that happened before the export: the choice of background gene set, the cut-offs for differential expression or whether up- and down-regulated genes should have been analysed separately. These belong in your methods section.
How do I cite MES.Plot?
See Methods & citation for a citation, a ready-to-adapt methods paragraph and the original references for each plot type.
Questions, or MES.Plot for a whole lab?
For questions, feedback from the lab or use by a group or institute, a short request is enough – MES gets back in touch.