
Plot types
All plots use the terms you select, in the order of the table. Colour always encodes −log10(adjusted P); where point size is used, it encodes the number of overlapping genes.
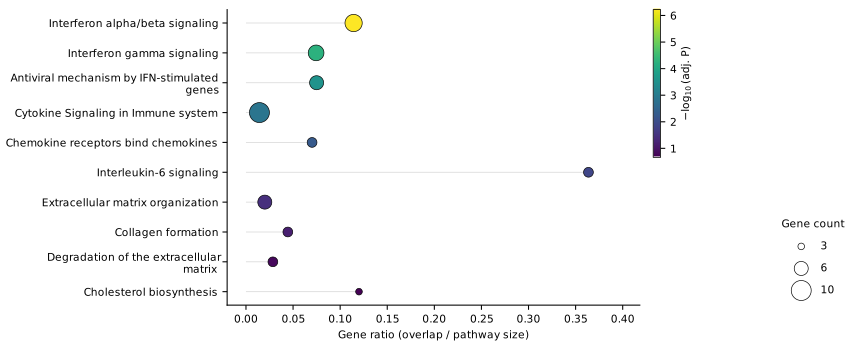
Dot plot
The classic: significance, gene ratio and size at a glance.
What it shows
One row per term. The position shows the gene ratio, the dot size the number of overlapping genes and the colour the adjusted P-value.
When to use it
As the main enrichment figure – it carries three variables in the space of a bar chart.
Encoding
- Y: term
- X: gene ratio = overlap / pathway size
- Size: number of overlapping genes
- Colour: −log10(adj. P)
Options
Sort order, guide lines, bold labels for significant terms.
Background: Popularised by the R package clusterProfiler/enrichplot.
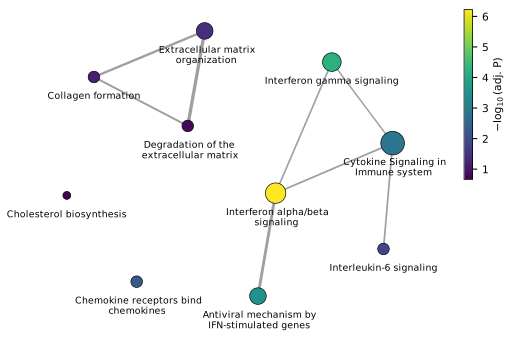
Enrichment map
Which terms describe the same biology?
What it shows
Terms are nodes; an edge connects two terms that share genes. The thicker the edge, the larger the overlap (Jaccard index).
When to use it
Whenever the top list contains several near-identical pathways. The map shows that they are one signal – reviewers often ask exactly that.
Encoding
- Node size: number of overlapping genes
- Node colour: −log10(adj. P)
- Edge width: Jaccard index of the gene sets
Options
Minimum Jaccard index for an edge (default 0.2).
Background: Merico et al., PLoS ONE 2010.
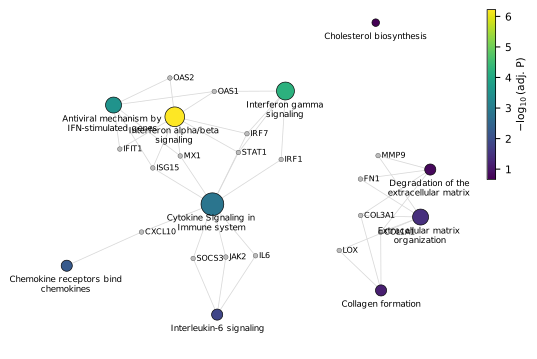
Gene–pathway network
Which genes connect the pathways?
What it shows
Pathways and their genes as one network. Genes shared by several pathways sit between them and become visible as hubs.
When to use it
To name the genes behind an enrichment – for example to choose candidates for validation.
Encoding
- Large nodes: pathways (size and colour as in the dot plot)
- Small grey nodes: genes (italic)
- Lines: gene belongs to pathway
Options
Show only genes found in at least N terms (default 2) to keep the network readable.
Background: Known as cnetplot from clusterProfiler/enrichplot (Wu et al., The Innovation 2021).
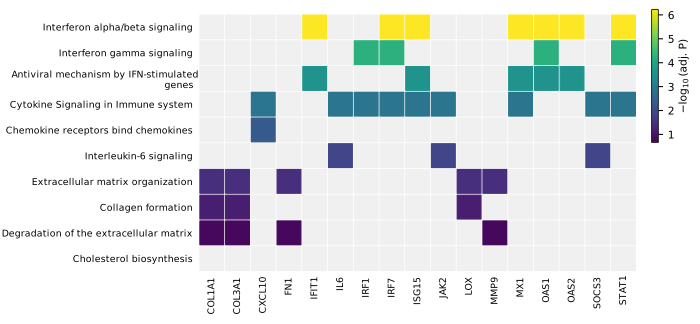
Term × gene heatmap
The whole membership table in one compact figure.
What it shows
A matrix with terms as rows and genes as columns. A filled cell means the gene is part of the term.
When to use it
When exact membership matters more than network structure – it is the most precise and most compact way to show it.
Encoding
- Rows: terms
- Columns: genes (italic)
- Cell colour: −log10(adj. P) of the term; grey = not in term
Options
Minimum number of terms per gene.
Background: Corresponds to heatplot in clusterProfiler/enrichplot.
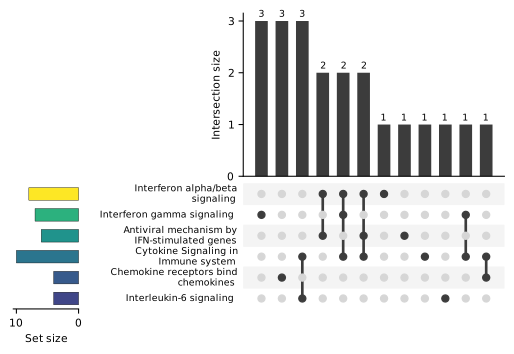
UpSet plot
Set overlaps without Venn diagrams.
What it shows
Every gene is assigned to exactly one combination of terms. The bars show how many genes each combination contains; the dot matrix below shows which terms take part.
When to use it
From about four terms on, where Venn diagrams become unreadable.
Encoding
- Top bars: size of each exclusive intersection
- Matrix: participating terms
- Left bars: set size, coloured by −log10(adj. P)
Options
Maximum number of intersections shown (default 20).
Background: Lex et al., IEEE TVCG 2014.
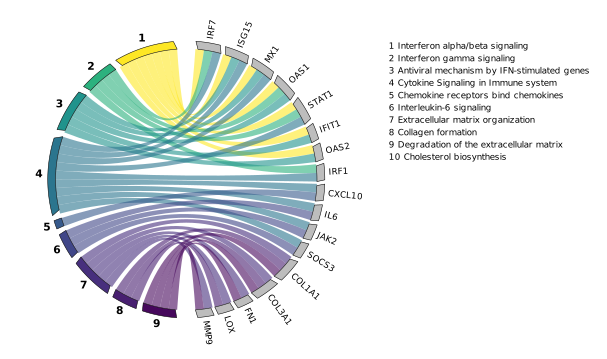
Chord diagram
Terms and genes connected by ribbons.
What it shows
Numbered terms on the left, genes on the right. Each ribbon links a term to one of its genes, in the colour of the term.
When to use it
For presentations and graphical abstracts, when a few terms share a moderate number of genes.
Encoding
- Left arcs: terms (numbered, key on the right)
- Right arcs: genes
- Ribbon colour: −log10(adj. P) of the term
Options
Minimum number of terms per gene.
Background: Similar to GOChord from the R package GOplot.
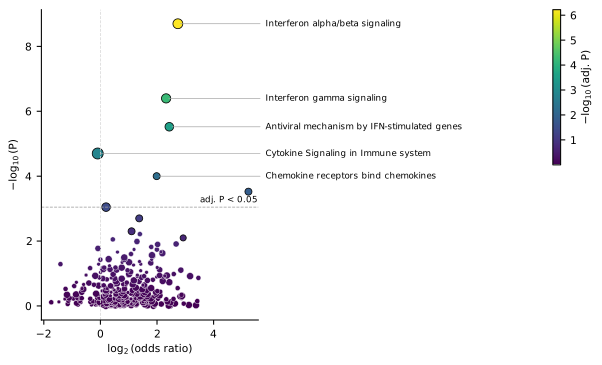
Enrichment volcano
All terms at once, not just the top ten.
What it shows
Every term of the library: effect size (log2 odds ratio) against significance (−log10 P). Your selected terms are labelled.
When to use it
To show that the highlighted terms stand out from the whole library – and where the significance threshold lies.
Encoding
- X: log2(odds ratio)
- Y: −log10(P)
- Size: number of overlapping genes
- Colour: −log10(adj. P)
- Dashed line: largest raw P with adj. P below the threshold
Options
Label selected terms on/off.
Background: Adapted from the volcano plot for differential expression.
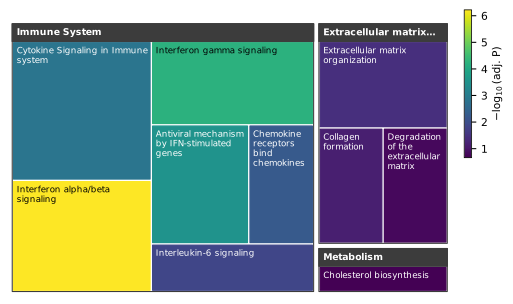
Treemap
Where in biology do your hits lie?
What it shows
Terms grouped by their top-level Reactome category (for example Immune System or Metabolism). The area of each tile grows with the number of overlapping genes.
When to use it
For an overview of which biological areas are affected – especially with longer term lists.
Encoding
- Groups: top-level Reactome category
- Tile area: number of overlapping genes
- Tile colour: −log10(adj. P)
Options
Requires the free Reactome files ReactomePathways.txt and ReactomePathwaysRelation.txt.
Background: Squarified layout after Bruls, Huizing & van Wijk (2000); hierarchy from Reactome (Milacic et al., NAR 2024).